
Solar Is Not a Commodity And Our Data Proves It
For years, the solar industry has moved toward standardization. Datasheets look similar. Specifications align. Warranties read nearly the same.
On paper, one module can appear interchangeable with another.
But in the field? The story is very different.
For more than a decade, we’ve been monitoring utility-scale solar assets across the globe. We’ve analysed data from:
4,000+ surveys
3,000+ assets
150+ manufacturers
40+ countries
After ten years of gathering real-world performance data, we decided it was time to pull back the curtain. Here’s what the data really tells us.
Insight #1: Solar Is Not a Commodity
The assumption that solar modules are interchangeable is convenient but it’s wrong. When we plot anomaly rate versus manufacturer, the spread is impossible to ignore. Even when modules share identical specifications on paper, their real-world performance diverges, sometimes dramatically. The variance isn’t marginal. It’s material.
Manufacturer quality drives measurable differences in field outcomes. The long tail of underperformance is real.
Some manufacturers consistently deliver lower defect rates. Others introduce significantly higher risk into portfolios. That difference compounds over time impacting yield, O&M costs, warranty claims, and ultimately investor returns.
What the Data Shows
Below is a visualisation of anomaly rate variation by manufacturer:
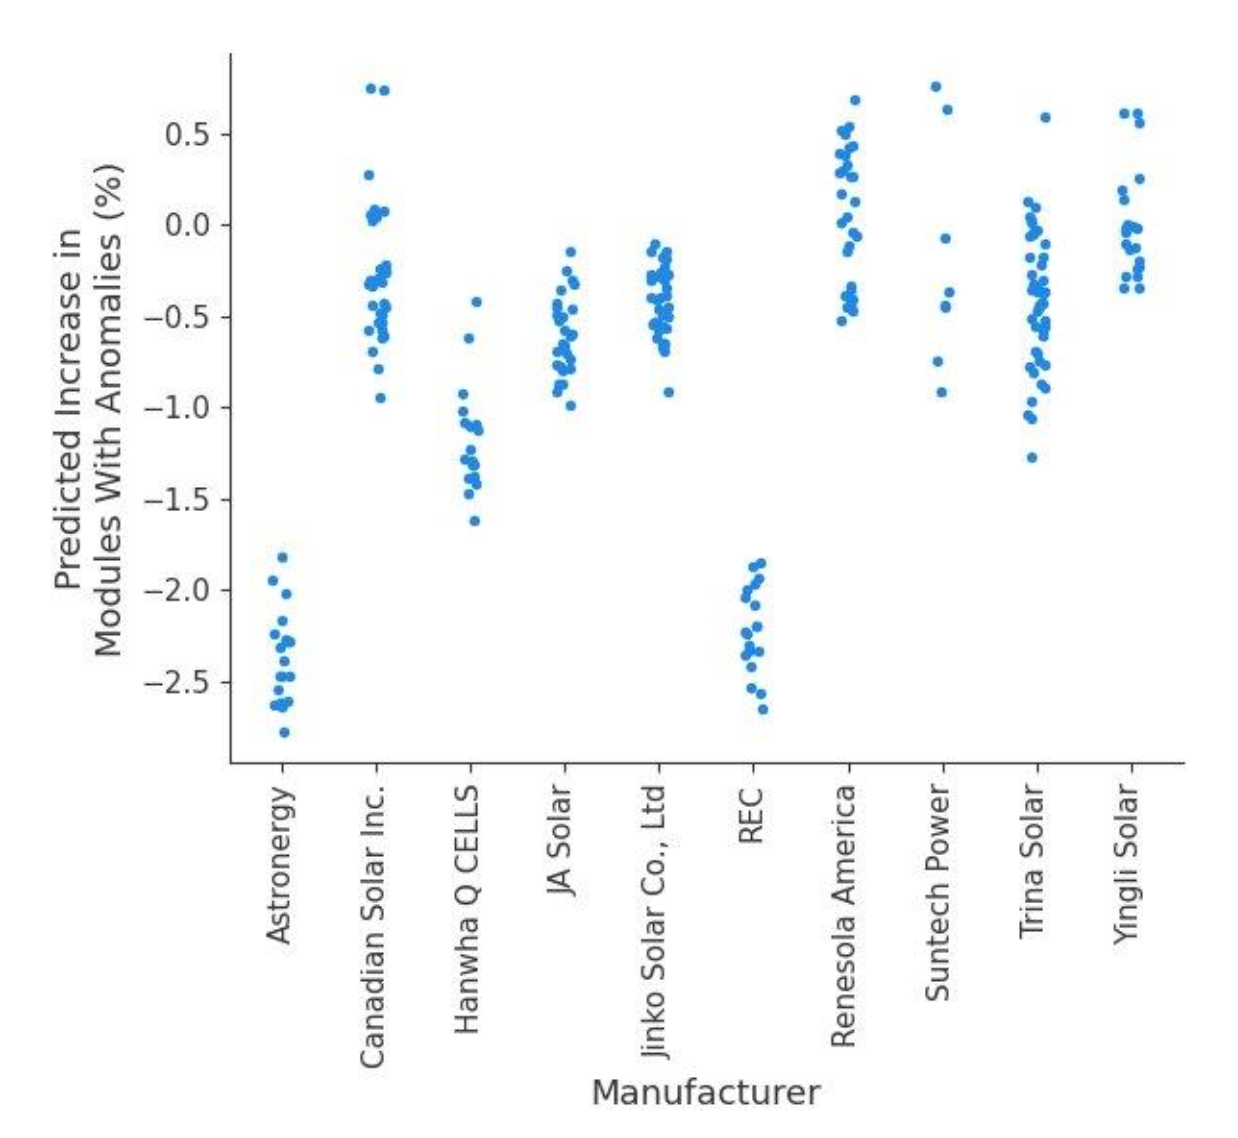
Each point represents the relative increase in defective modules based solely on the choice of manufacturer. The y-axis shows the percentage increase in defective modules attributable to manufacturer selection alone. This isn’t about minor production variability. It’s about systematic performance differences that show up consistently across geographies, climates, and project types.
In short: identical specs ≠ identical performance.
Why This Matters
Treating solar as a commodity ignores risk embedded in manufacturing quality.
At utility scale, even small percentage differences in defect rates can translate into:
Millions in lost revenue
Increased maintenance burden
Elevated warranty enforcement costs
Portfolio-level performance drag
Procurement decisions are not just about price per watt. They are risk decisions.
And the data makes that clear.